Sustained Growth in Gross Domestic Product (GDP): Peru Leads the Region
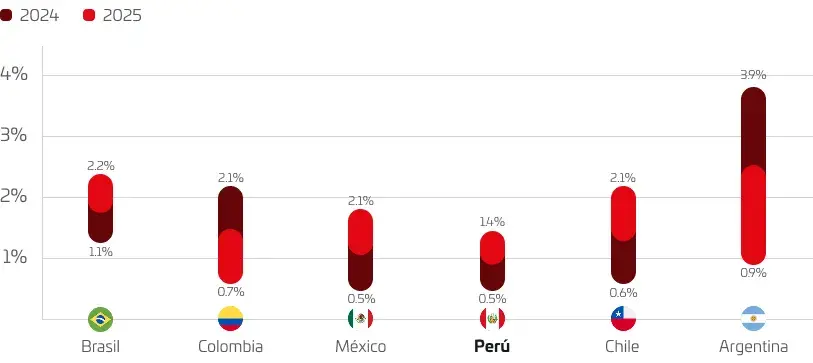
According to estimates from the World Economic Outlook, published in October 2024 by the International Monetary Fund, Peru will rank as one of the countries with the highest GDP growth in Latin America (alongside Brazil) at the end of 2024.
Peru’s economy is expected to grow by an estimated 2.6 percentage points in 2025, outpacing key countries such as Colombia, Chile, Mexico, and Brazil.
Latin America: Gross Domestic Product Projection, 2024-20251/
(Actual annual percentage variation)1/ The arrows indicate revisions to the IMF’s WEO projections for Oct-24 compared to those for Apr-24.
Source: International Monetary Fund.
Sustained Gross Domestic Product (GDP) Growth: Stable and Promising Performance
Over the last 10 years, Peru’s Gross Domestic Product (GDP) has shown steady growth, with an average annual increase of 2.3%. This performance underscores the stability and resilience of the Peruvian economy, laying the foundation for an even more promising future.
Year
GDP (millions of soles in 2007)
Percentage variation in GDP
Average
2,3%
2014
467 308
2,4%
2015
482 506
3,3%
2016
501 581
4,0%
2017
514 215
2,5%
2018
534 626
4,0%
2019
546 605
2,2%
2020
487 191
-10,9%
2021
552 560
13,4%
2022
567 390
2,7%
2023
564 261
-0,6%
/1 Extracted from MMF for 2025-2028, Ministry of Economy and Finance.
Note
The GDP estimate for 2024 in soles, based on the percentage variation in the MMF for 2025-2028 for that year.
Source: Central Reserve Bank of Peru.
Per Capita GDP Growth: Improving the Well-being of Peruvians
Over the last decade, Peru’s real GDP per capita has grown by an average of 0.9% annually, reflecting a steady improvement in the economic well-being of its citizens. This steady growth highlights the country’s ability to generate more value per capita, driving development and quality of life throughout the territory.
Year
GDP per capita (Soles in 2007)
Percentage variation in GDP per capita
Average
0,9%
2014
15 779
1,4%
2015
16 103
2,1%
2016
16 487
2,4%
2017
16 602
0,7%
2018
16 939
2,0%
2019
17 012
0,4%
2020
14 933
-12,2%
2021
16 726
12,0%
2022
16 989
1,6%
2023
16 731
-1,5%
Source: Central Reserve Bank of Peru.
Contexto Macroeconómico – Indicadores Macro – Crecimiento EN
Redireccionando…
Contexto Macroeconómico – Indicadores Macro – Crecimiento EN