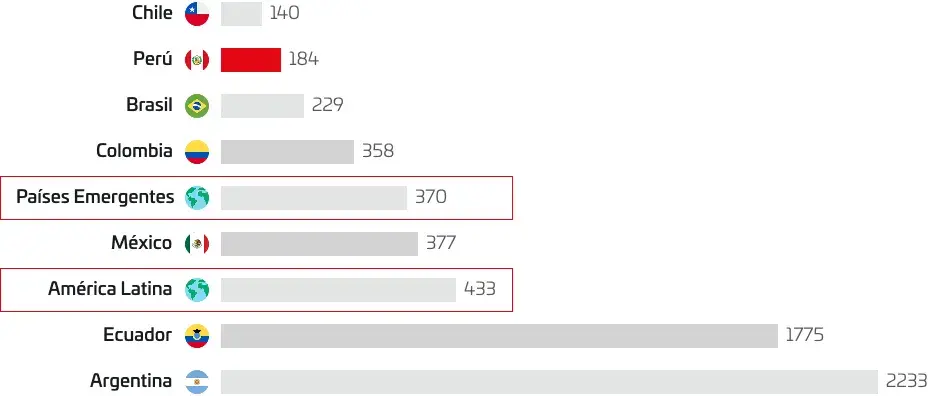
Responsible Fiscal Policies: A Model in Latin America
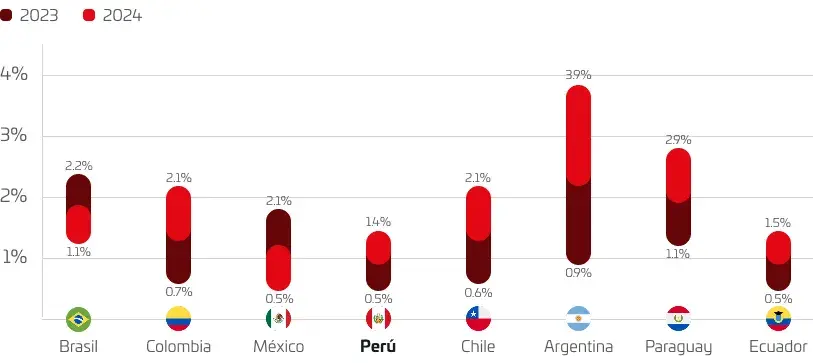
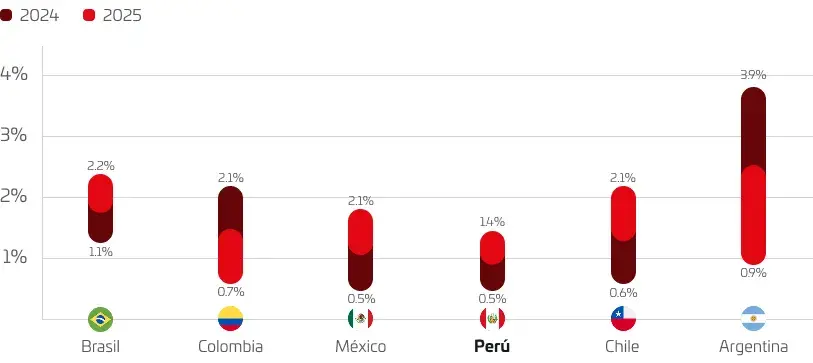
Controlled Inflation: Peru is in an Advantageous Position in Latin America
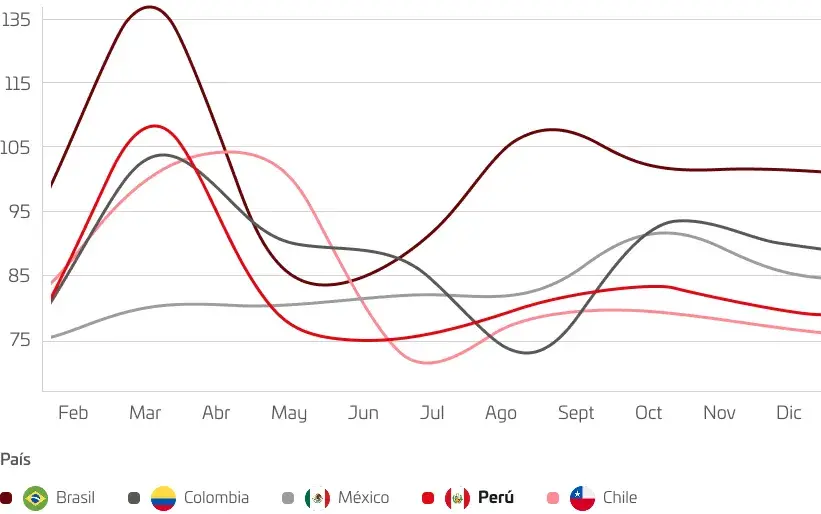
Weakening of currencies in Latin America
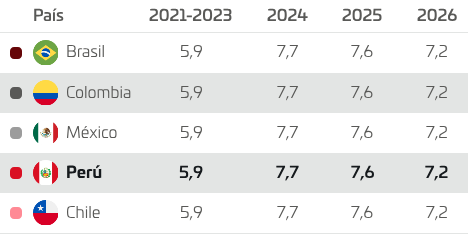
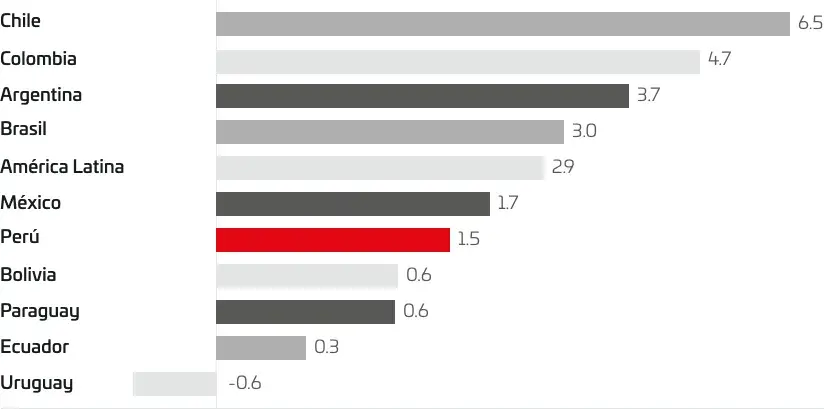
Sustained Growth in Gross Domestic Product (GDP): Peru Leads the Region
Sustained Gross Domestic Product (GDP) Growth: Stable and Promising Performance
Per Capita GDP Growth: Improving the Well-being of Peruvians
Investment Growth: Driving Sustainable Development
Private Investment Participation: A Pillar of Economic Growth
Private Investment: A Key Driver of Peru’s GDP
Peru: Exceeding the Regional Average in Foreign Direct Investment
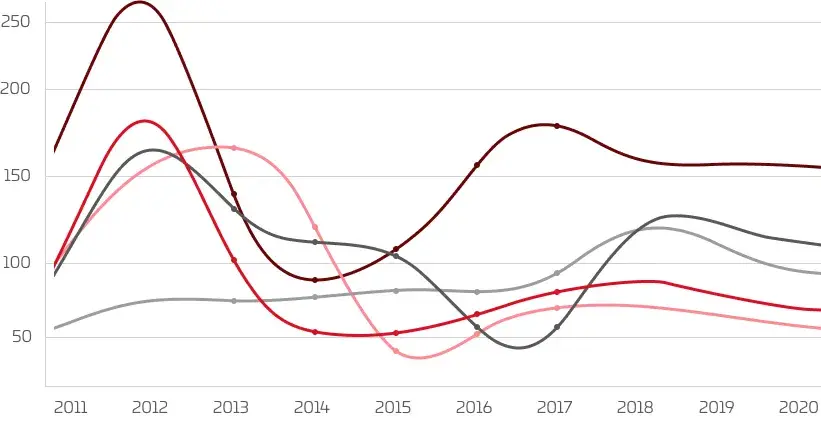
Economic climate indicator in Latin America
Expectations Indicator for the next six months in Latin America
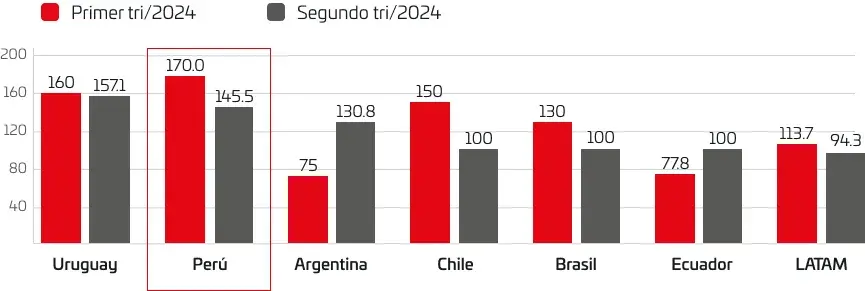
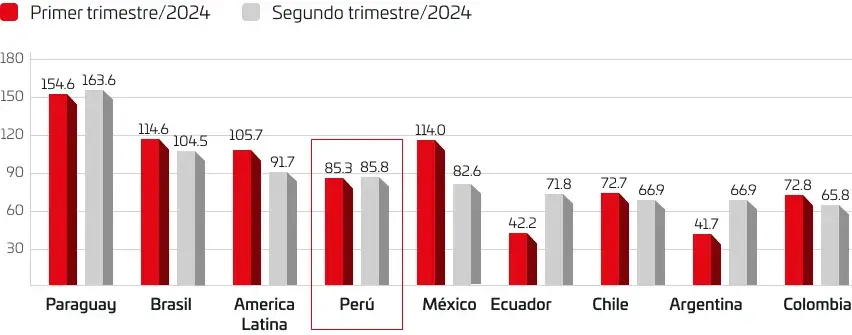
Business Confidence Indicator
Country risk